
Many years ago I remember hearing a story about a lady who loved the outdoors. She especially loved birds and she would watch them from her front porch every day. She would constantly put out seed and fill her bird bath in an attempt to attract them so that she could enjoy them in her yard. The lady did indeed attract some birds with her seed and the little pool of water but they were always the same old common species; a bright red cardinal here, a curious tufted titmouse there, and an occasional northern mockingbird at the bath. Frustrated and curious why there were no “interesting” species in the area, she called up an old friend who happened to be an amateur ornithologist. After they had finished a glass of iced tea on the porch and she had explained the lack of diversity in the area to him, she asked why this was the case and pondered what she could do or where she could go to experience the warblers, tanagers, flycatchers, and vireos that filled the pages of her field guides. Her friend smiled and explained to her that she need only to venture a little ways from the porch to find them. In fact, in the seven minutes it took them to finish their tea, he had heard and distinguished no less than twenty five individual species in the woods and old-field just beyond her yard. The lady was both astonished and delighted but at the same time she was a little bit embarrassed. The lady learned a lesson that I will try to relate in this article. The point is different groups, and sometimes individual species, of wild animals are best detected using a variety of different methods, depending on their biology, behaviors, and life cycles. Most passerine birds (the target group in the story above) for example, are most efficiently discerned using sound (songs and calls), rather than a single type of food bait. This article will provide an overview of the various survey methods and techniques for a variety of both game and non-game terrestrial wildlife species.
Before we get into discussing the wide array of modern survey methods, it is probably worth clarifying a few terms related to the subject. I often hear land managers and wildlife biologists discussing surveying, sampling, inventory, and monitoring; and sometimes they may even use these terms interchangeably. However, in a scientific context each of these four terms, while they are similar, actually implies something completely different. To survey means to examine or search for something (whether or not you may actually find it). As a noun, a survey is this search or examination itself. A sample implies you’ll be examining or testing by taking a part or piece of something (which means you have to find or have something in the first place). An inventory implies you will be finding and listing all the target critters in an area. In other words, an inventory is like a census. And finally, the term monitoring implies a surveillance of a target over a period of time. Monitoring typically means you’ll not only be finding something, but repeatedly looking at it in an attempt to determine trends.
As we established earlier, there are plenty of methodologies out there to survey for wildlife species in a particular area. To determine what method is most appropriate, managers often consult books, scientific literature, or someone with knowledge about the target group. And depending on the type of wildlife a land manager is interested in surveying, the purpose and nature of the survey, and the level of accuracy needed, the manager may elect to conduct the survey himself or hire a consulting biologist. Some species are easy to detect, some seemingly impossible (although we know they are probably there). This variability has to do with a wide assortment of factors like home range, size of the animal, behavior, and the kind of habitat in which it lives. More often than not, a survey will be designed to provide more than just presence/absence data. Density, relative abundance, diversity (implying a survey for multiple species), habitat use, seasonality, and population trends (implying monitoring) are all factors that are commonly of interest when conducting wildlife surveys. An internet (or field guide) search of the species’ range is a good place to start. Knowing whether you are within the known range of a species will narrow down the list of potential species on a particular tract. Reasons for conducting wildlife surveys vary as much as methodologies, and can range from pure research in regards to population monitoring and ecosystem health (typically universities and/or government agencies), to hunting and private land management purposes (typically private land managers or consultants). The following are some of the most common techniques.
Sound-Based Survey Methods
As we established earlier, many species are most efficiently detected using sounds. Bird point counts conducted in the breeding seasons (May or June) are probably the most common example of non-game avian survey. This method focuses on both resident and migrant songbirds. While most landowners do not consider these counts, they can actually provide very good information about the health and functionality of the habitats on a particular tract of land. This is because birds are effective habitat indicators and are quite predictable in their association with vegetation structure and composition. As habitats change or management occurs, changes in breeding bird assemblages would be expected. Consistently picking up species like Bachman’s sparrow, prairie warbler, and field sparrow lets you know you are providing the early successional habitats that are needed by other species like bobwhites. Some landowners just want to know what species of wild birds use their property.
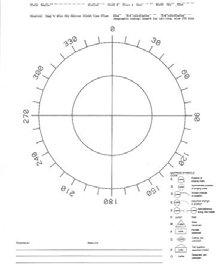
Breeding bird point counts involve recording all birds seen or heard (the vast majority will be detected only by song or call) during a set period of time (typically 10 minutes) in the morning along with weather conditions and a few other pieces of environmental information. While facing north or another known direction, bird species codes (there are published four-letter codes for each individual species) are recorded on a data sheet in the direction and at the estimated distance of the call. This method allows the observer to keep track of what birds are calling during the count and prevents duplicate recording. Counts are generally taken from a set point once or twice a year so that trends can be observed over time. These surveys are essentially free to conduct and basically require only the knowledge of bird calls and songs. These skills can take a while to master however and may fall outside the ability of the average landowner. There are many consulting biologists who can provide these services. Like most of the following survey methods, data collection is important. We won’t go into deep detail here but at the very least using a spreadsheet or some similar way of logging and analyzing data is essential in keeping the records generated from any surveys. This information may later be used to inform management decisions.
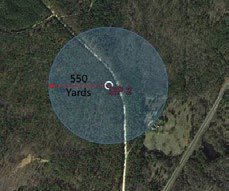
Game bird surveys vary, but for the most part, like song birds, they can also be detected effectively using sound. Formal wild turkey gobble counts are conducted during the springtime in a similar fashion as breeding songbirds, or so they tell me. Personally, the only gobble counts I ever do are with my shotgun on my shoulder. That’s why I did my graduate research on non-game bird communities; they can be done after turkey season! When it comes to using sound-based surveys for quail however, the techniques are usually a little different. While you can and will certainly detect bobwhite cocks whistling during spring point counts (in appropriate habitats), their populations are more typically assessed during the fall using quail covey counts. These covey counts can be performed by the average landowner and they basically involve a similar principle as the counts described above. However, these surveys rely on a different type of call; the covey “break-up call” as opposed to territorial singing. If you have never heard this distinctive call in the wild, it can readily be found online with an internet search. With covey counts, set points are established at optimal listening points across a property and observers record coveys calling just after daylight, on a cool calm fall morning (usually in October-November). Most calls occur a half hour or so before sunrise and last only a few minutes. This type of survey is different from breeding bird points in that it is a “one point per morning” deal. With breeding counts you can move from one point to the next as the morning progresses and obtain data for several 10 minute counts, whereas the break-up call is only performed once in the early morning. This usually means several folks must participate on the same morning to cover large areas (the preferred method) unless fewer observers can commit to multiple mornings. Each observer can be expected to detect quail over about a 200-acre area, or about 550 yards in any direction (Univ. of Missouri Extension, 2010). On a relatively small tract, plan enough listening stations to essentially cover all the usable property. Each observer records the number and location of the covey heard on a data sheet. The number of coveys heard is adjusted by a factor that compensates for coveys which may not have vocalized that morning (see Table 1). In other words, if several coveys are calling they tend to make other coveys “speak up”, thus making them more likely to be detected. Some managers also use an adjustment formula that considers change in barometric pressure, cloud cover, and wind speed to further refine the estimate. These covey estimates are then typically used to generate an estimate of quail density. To calculate density the following formula is used: number of coveys estimated multiplied by 12 (average covey size) divided by the number of acres surveyed. This will provide a raw estimate for acres per quail (or one quail per X acres). Since bobwhites have relatively small home ranges, these counts can also be used to spatially map essentially all the coveys across a property. If quail management work is planned for a property, most managers will want to take baseline surveys and subsequent counts on an annual basis to determine the population response.
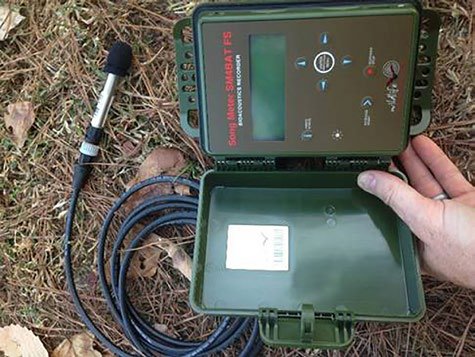
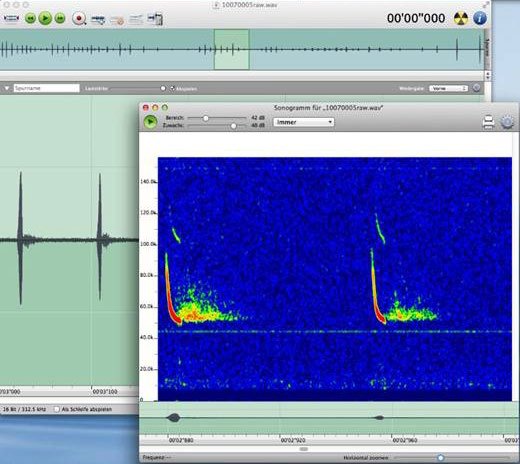
There are a number of other species that are often detected via their calls or sounds. Frogs for example are another group that “sing” in the late winter and spring to establish territories and attract mates. This often makes them easy to detect and identify to species, even in a dark and cold swamp. While songbirds and frogs sing on their own accord, species like owls and wolves are often surveyed for by reproducing their calls and then listening for their respective replies. Owl hooting and wolf howling surveys (where the observer does a series of hoots or howls) are typically conducted along a road to cover a lot of ground, since these are after all very mobile creatures. Modern technologies have changed the way some audio-based surveys are conducted, and sensitive audio recorders can now be used to capture the vocalizations of certain animals, especially if the calls are soft, infrequent, or difficult for the human ear to distinguish. Bats, for example, were until recently most often surveyed only by capture (mist or harp netting) or direct observation (within or emerging from hibernacula), but now full spectrum recording technologies are available. Sensitive audio recorders take advantage of the echolocation calls and other vocalizations active bats make. These listening devices can be used over time at a fixed point or can be integrated with GPS to run driving routes or transects. These instruments can detect flying bats at over 50 yards away. Special software can then be used to interpret the sounds and even distinguish individual species. Sometimes these types of recorders are even left to collect data for days or even weeks. The audio data can then be downloaded and analyzed in the comfort of a lab or office. Generally, these recorders are used for research projects and endangered species monitoring, rather than in typical private land management.
Capture Surveys
Live capture remains a standard and a popular way to determine what wildlife species live in an area. Live capture includes such methods as mist-netting, live trapping (cage traps), and pitfalls. Bats and birds are often mist-netted, especially when banding or collecting tissue samples. Mist nets are typically made out of fine black nylon or polyester material so that they cannot be easily seen or detected. These nets are raised in strategic areas and are checked constantly to minimize the amount of time target animals are in the net and therefore reduce stress and risk of injury. The observer removes the captured individuals, takes measurements, fits a band, collects any other data needed, and then releases the animal unharmed.
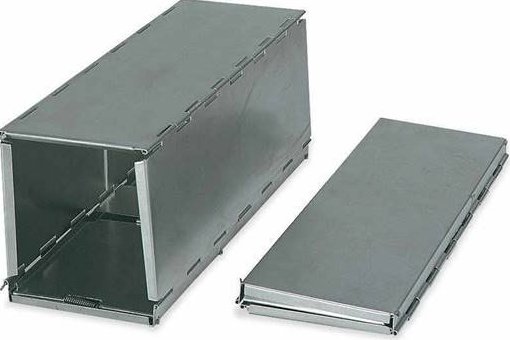
Live cage trapping is typically the preferred method for small (non-flying) mammal surveys. The Sherman trap is the most popular small mammal trap system and they fold up so that a large number of them can be easily transported into the field. These little live traps are used to detect and survey native shrews, mice, voles, cotton and wood rats, chipmunks, and squirrels. They are usually baited with a mixture of rolled oats, mixed bird seed, and peanut butter. A typical array of Sherman traps consists of six transects laid out to form a hexagonal pattern 400 meters across, with traps placed every 20 meters (total of 80 traps). Traps are checked and rebaited if needed twice daily (morning and again before dark) for at least three consecutive days (72 hours). This is a fairly intensive survey but this protocol will provide estimates for species richness and relative abundance for the small mammal communities in an area. Most small mammal surveys are conducted for research purposes. Pitfall traps are basically what the name implies, a bucket or jar that is level with the ground which serves as a pit that small animals fall into. Some small mammals (especially shrews and gophers) are effectively detected by using pitfalls.
A long-standing method of estimating the population size of a species that is often used in conjunction with live trapping is the Mark and Recapture system (sometimes also called the Peterson Method). It is a fairly effective way of assessing abundance when there are either too many individuals in a population to count or when the species is cryptic or difficult to see. Using this method, a subset of a population is trapped, marked in some way (for example with a band, paint, tag, etc.), and then released back into the population. After a certain window of time has passed the population is trapped again and the number of marked individuals in the second trapping sample is divided by the proportion of marked individuals to give an estimate of population size. The following scenario can be used as an example. 100 aquatic snails are picked from a large slab of bedrock (trapped), dried with a towel, and marked with a painted dot on their shells. They are then released back into the stream (at the same site), allowed to mix back into the population, and in one week are trapped again. A total of 90 individuals are captured in the second sample and, of those, only 10 are marked. The following formula provides the estimated population size (P): P = A x B / M, where A represents the number of individuals marked initially, B is total number of individuals captured in the second sample, and M is the number of marked individuals in the second sample. Considering our numbers (100 x 90 / 10), the population estimate is 900 snails. This process can be repeated and implemented over multiple sites and then averaged to increase the accuracy of the estimate.
If the mark is unique to a specific individual (an exclusive identifier like a numbered band), this method can also be used to gather additional information about growth rate, longevity, habitat use, migratory patterns, and a great many other biological and ecological data, when the individual is recaptured over longer periods of time. As an example, a female pine snake is caught, measured, weighed, pit-tagged, and released at one year of age. She happens to be captured again at the same site one year later as an adult snake and is found to be gravid (with eggs) and significantly larger than the expected normal for a 2-year-old. These data suggest that habitat for this species in the vicinity of the trap location is of high quality and the population is reproductive and appears to be healthy.
Direct Observation Surveys
Direct observation, visual encounter, or other sight-based surveys can be employed for many wildlife species. One fairly common example of this kind of methodology is the spotlight count. Spotlighting can be fairly effective for both ungulates (hoofed animals) and rabbits. Spotlight counts are used to estimate density and abundance by directly observing individuals during the night when they are most likely to be detected. Furthermore, many of these nocturnal species exhibit “eye shine” which make them easier to see. Typically, a spotlight survey is conducted along a pre-determined road route from a slow-moving vehicle (with a driver and two observers; with one shining and looking left and one shining and looking right). Animals are recorded on datasheets. Dense vegetation makes detection less likely, therefore sight distances (how far the observers can see into the woods) are also recorded at regular intervals along the route. Sight distance is averaged and multiplied by the length of the spotlight route. This area calculation allows an estimate of density (acres per deer) to be estimated. In other words, if the average sight distance is 250 feet on each side of the road (500 feet total) and the route is a mile long (5,280 feet), this suggests a survey area of 2,640,000 ft². Divide by 43,560 to convert to acres and we come up with about 61 acres. If a total of two deer were seen during the survey, the estimated density would be approximately one deer per 30 acres. Obviously, you wouldn’t want to base density on a single one-mile sample but this is the general concept. This estimate becomes more accurate with multiple sample runs. Although it is illegal to spotlight in many areas, wildlife managers and biologists can often request and obtain a permit for conducting controlled spotlight surveys for research and management needs.
In daytime, simple walking transect counts are sometimes used to count wildlife using the same general principle as the spotlight count. Number of individuals observed is divided by area observed (which is calculated in a similar way by multiplying transect length by the average sight distance) to give an estimate of density. Walking transects typically cover much less ground and aerial counting (from a plane or helicopter) is sometimes used to determine population and herd size in some larger species (like bison, elk, feral pigs, etc., especially in wide open terrain). These counts are more common in western states, in prairie, desert and grassland dominated habitats.
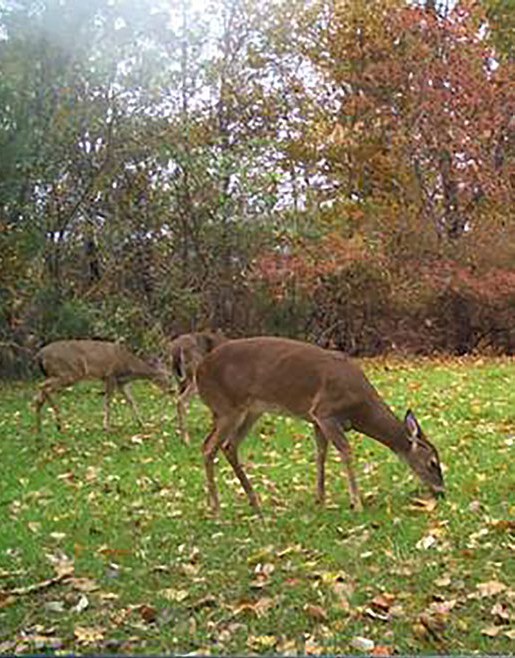
Many common visual survey and monitoring techniques nowadays use modern camera technologies. Game and trail cameras have become much more advanced (and much more affordable) over the past several years. Cameras significantly reduce the amount of time an observer has to spend in the field and they can be employed in multiples. And they are very effective in detecting some groups of wildlife on a property. Not all wildlife species can “set off” the camera and so they are more commonly used to survey large birds and mammals.
Cameras are associated by most folks in the way they are used by hunters to scout for deer. It is true that individual deer can be patterned and their schedules can be studied by employing a few cameras at food plots, or along trails. But these cameras can be used in so many other ways, ranging from intensive research projects to active management applications. For example, automatic cameras have been used successfully in studies to examine nest predators of bobwhite quail, turkeys, and other ground nesting birds. They are also invaluable when it comes to whole-sounder feral swine trapping. Pre-baiting and using cameras to ensure that all the individual pigs of a sounder are comfortably feeding and entering a trap is critical when your goal is to capture the entire maternity group (which has proven to be the most efficient method of eradication and control). Cameras are now commonly used in estimating deer density, sex ratios, and recruitment. Location and placement of cameras is just one factor to consider and may best be determined by the kind of information the manager is interested in, as well as life cycle of the animal. The same is true for timing of a camera survey. Recruitment for example (essentially calculated from fawns per doe) is a valuable piece of information, especially when trying to determine the appropriate level of antlerless deer harvest in areas with high coyote populations. Fawn recruitment can be estimated using cameras, but a survey in July versus September versus November will produce different results. In July, (in some parts of the South) fawns may not have been dropped yet. In September, they may have dropped but still not be with their mothers. November will likely capture a “truer” picture of fawns per doe. If surveying in fall however, during a high mast crop year, a camera along a high use trail may actually prove to be more productive than one located at a food plot. Identification skills are important to develop when using cameras (in order to determine does from older fawns, etc.) since you may only be looking at single photograph images. Setting the camera to video or for multiple shots (along with enabling the time and date) will help ensure an accurate representation of family group is captured. With careful and skillful identification, mark and recapture methods can actually also be conducted using non-invasive camera surveys to determine abundance. With deer, this level of individual identification is obviously easiest to make in antlered bucks (which often have distinguishing characters in their antlers).
Cameras are also commonly used to “capture” the presence of rare and secretive wildlife species. In recent years they have been used to examine the abundance and range of eastern golden eagles, spotted skunks, black bears, and mountain fox squirrels, to name a few. Strategic settings and locations (often associated with specific baiting techniques) are generally used when pursuing cryptic wildlife with cameras.
Another non-invasive concept similar to the camera survey is called the track plate survey. Track plates are a low-cost way to test for the presence of some mammals (especially carnivores), and as the name implies, they are based on the identification of footprints left on a plate or sheet after the target animal walks over a chalked mat or paper. Carbon black is also sometimes used instead of chalk. A potent scent lure is typically used in the center of, or behind, the track plate. American martens and black-footed ferrets, fishers, lynx, wolverines, bobcats, otters, voles, lemmings, and squirrel and rabbit species can all be effectively detected using track plates. Mud track plates are essentially free to set up and use basically the same idea; a plot of mud that is wiped smooth and “clean”. Mud plots (typically one meter square) can be used without bait and therefore can provide a more accurate picture of habitat use and natural movement, and can be used for other mammal and wildlife groups. Since there is no bait or lure, they are usually checked after longer periods of time (a week or longer).
Wildlife survey and monitoring methodology has evolved greatly over the past few decades. New technologies are leading to more effective and cost effective ways to survey. Some species that were thought to be extirpated are actually being re-discovered in some areas thanks to cutting edge research and inventory techniques. For example, eDNA assays (conducted by sifting through the genetic material filtered from a river or lake) can now be used to detect species-specific DNA in water samples. Cryptic animals like hellbenders, turtles, and some rare fish species are being studied in this way, and these eDNA techniques are fast becoming the new wave of aquatic survey and research. Whether using advanced concepts such as these or just taking a good old fashioned walk through the woods, there are countless approaches to help a land manager determine what’s out there.