

This article is a continuation of the theme begun by Harry Jacobson in the Dec. 2001 issue of Wildlife Trends. His article, “How to Conduct a Deer Census on your Property, Part I,” outlined three different types of censuses available for monitoring deer populations. This article covers a fourth option, the camera survey.
With recent technological advances, researchers and now landowners have been able to “spy” on wildlife populations using game cameras. In the 1980’s these cameras were a hassle because they used rolls of 35mm film that had to be replaced often and were not necessarily housed in weather-resistant containers. Digital technology, improved battery life, and ease of use have made today’s game cameras worth the cost based on the wildlife management data they can provide.
Researchers have been able to use photos to identify individual bobcats by their coat patterns, monitor nesting ground birds and record nest predators, and conduct presence/absence studies on wild hogs and bears. Researchers are also testing the use of game cameras to survey wild turkeys. Landowners have been able to take these same cameras and use them to locate harvestable bucks and monitor predator populations on their properties while also catching a few poachers and timber thieves on film. By far, though, the most common use of the game camera is to monitor deer herd dynamics through camera surveys. These surveys, when conducted correctly, are 90% effective at capturing all deer present on a given site. This is much more accurate than the spotlight count method. A “survey” differs from a “census” in that a survey is an estimate of deer populations whereas a census is a complete count of all deer in an area. Since the latter is not possible for most people to do, a photo count is extrapolated out to get a population estimate. However, it is the seasonal trends in deer density, sex ratio, and age structure that provide the most valuable information on herd health and how many to harvest.
Some factors to keep in mind when deciding when to conduct a survey include time of year, natural food sources available, and bait to use. Most researchers recommend the fall and winter months for taking surveys because the sex ratio is easier to observe. Fawns from that year will now be accompanying the does to the bait while bucks will have developed their antlers, making it easy to distinguish them from the does. Just make sure that the timing of the deer survey is early enough so that the acorn crop doesn’t distract the deer from the bait (August-October) or late enough so that antlers are still present but no more acorns are available (January-March). Research has demonstrated that the best bait to use for attracting deer within camera range is corn. Protein pellets and salt/mineral licks have been tested and are not as effective.
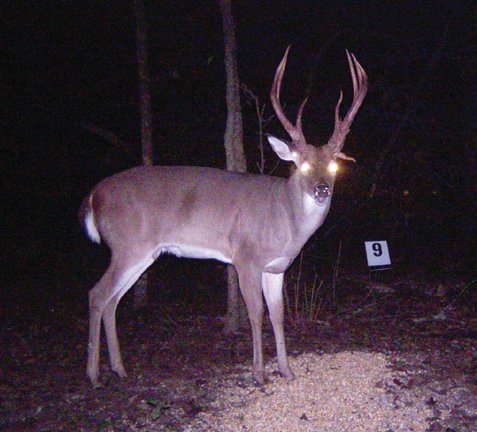
Deer behavior is important to understand before conducting a survey. Some researchers believe that the flash from a camera can spook deer, especially does, making them less likely to return to the site of the incident. However, my personal observations have shown the same does revisiting bait in front of a flash camera so much that I got tired of seeing the same groups over and over again after day. Another research finding is that bucks and does appear to utilize different habitat types on a seasonal basis and visit feeders at different times. It has been suggested that bucks are more likely to visit baits at night, and I have witnessed this at my own sling feeders and crib feeders. I also know which site is going to provide mostly doe pictures and which site will be overwhelmingly bucks. However, since all sexes and age classes do visit bait stations, I am confident that I am capturing a good representative sample of the deer population utilizing my property.
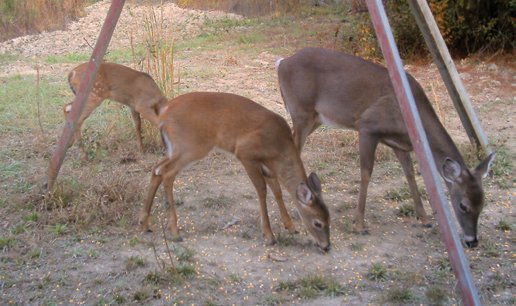
Interestingly, a study from southern Texas demonstrated that a captive herd of deer could be conditioned to feeding at specific times. If they heard the sling feeder go off or knew it was time for it to go off, they showed up to eat. The implications of this are that if free-ranging deer can be classically conditioned to react the same way, feeders could be programmed to go off at optimal light conditions for camera surveys, avoiding pictures of non-targets like nocturnal raccoons. Additionally, deer could be “trained” to become active when hunters are more likely to be afield, although this probably violates fair chase ethics.
With every type of scientific study, there is a protocol to follow in order to avoid collecting erroneous data and therefore coming to the wrong conclusions. The method most often followed is one developed by Mississippi State University. The first step is obtaining the best camera for the job. The best cameras are those that are based on heat (infrared) and not movement. Otherwise, you run the risk of getting a hundred pictures of leaves waving in the breeze. Other pluses when camera shopping include a waterproof housing, long battery life, long flash range, and a date/time recorder. (I personally use a Cuddeback Expert™ camera because it has consistently given me color photos with little blurring, and the flash does not seem to spook the deer.) Next, take a map of the property to be surveyed and divide it into 100 acre compartments. Place one camera roughly in the center of each plot. Understandably, if the property is several hundred acres in size, the amount of high-quality cameras that would be necessary to cover the tract can be cost-prohibitive. Therefore, one or two cameras can be rotated around the property during the survey time frame. Make sure to clear the vegetation around each camera and bait site. Add a feeder or pile of bait approximately 12 feet from the camera and at the height of a deer (make sure the flash of the camera will cover this distance). If using piles applied directly to the ground, use 30-40 pounds. However, if moisture is a problem, 15 pounds of corn should be used so they do not grow a fungus that harbors aflatoxin. Check all bait piles daily and add more corn as needed. Allow the bait stations to remain active about 5 or 6 days before setting the cameras and starting the survey so the deer have time to become accustomed to the site. [NOTE: It is important to notify your local game warden of your survey if you are in an area where baiting during the hunting season is illegal.]
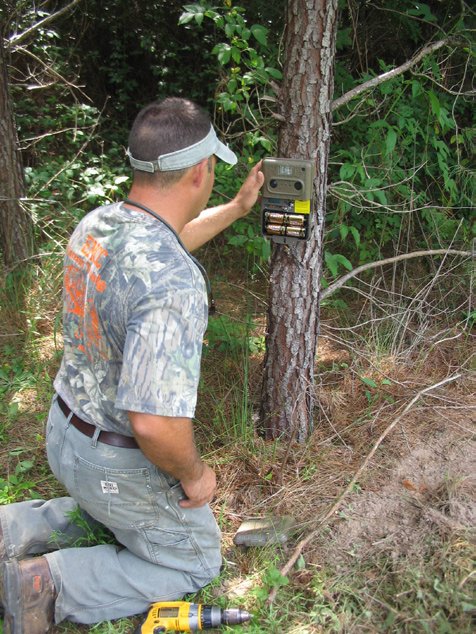

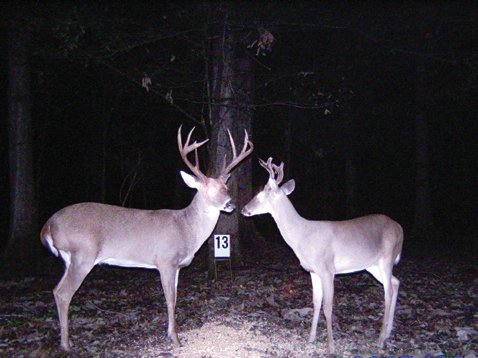
Make sure the date and time recorder is set on the camera. Some researchers suggest setting the photo delay anywhere from 4 to 12 minutes so there aren’t multiple shots of the same deer, but with today’s digital camera cards being able to hold hundreds of pictures, it really does not matter how many shots are taken. It only means more photos to look through and some alternate views that may help identify individuals better. If the bait station is located along a trail, the delay should be only one minute since it will be hard enough to catch the individuals passing through an area. Westervelt Wildlife Services, a consulting and management business that offers deer surveys for its customers, often positions a numbered card in view of the camera so that photos can be easily linked to a specific location. This is a good idea for the landowner to incorporate into his/her own deer survey technique. The signs can help identify the location of buck hotspots or where cameras have malfunctioned.
Once the survey begins, leave the camera in place for 10 consecutive days in order to document 90% of the deer on the property. Leaving the cameras longer will not produce a higher count according to statistics. After printing the photos, analyze them to determine how many photos exist each of bucks, does, and fawns. Also, since the antler characteristics of bucks make them easy to identify to individual, write down the total number of individual bucks. Disregard photos of unidentifiable deer; do not include them in the count. Does and bucks are easy to identify in fall/winter surveys since antlers will be present on bucks. (Forget about the possibility of the rare antlered doe!) Fawns, on the other hand may be difficult. For camera survey purposes, a “fawn” is a deer of either sex under the age of one.
Assuming that both sexes equally visit feeders, a population factor can be figured. This number is a filter for the repeats (same deer seen over and over). Using the buck numbers, divide the number of individual bucks by the total number of photos of bucks. This number is the population factor. An additional calculation is the extrapolation factor of 1.11 which will cover those deer that were not captured on film during the 10 days. (The figure 1.11 is derived from a chart for the “percent of the ‘best estimate’ of deer” for 100 acres by Mississippi State University researchers.) Now we are ready to estimate the number of bucks, does, and fawns in the population. Multiply the number of individual bucks by the extrapolation factor of 1.11. Multiply the total number of doe photos and the total number of fawn photos each by the population factor, and then multiply each result by the 1.11 extrapolation factor. Sum the final results of the bucks, does, and fawns and this will give the number of animals in the total population. To get acres per deer, simply divide the total number of acres surveyed by the total population. The buck to doe ratio and fawn to doe ratio (and percent recruitment into the population) can be calculated as well from the above data. To better demonstrate these calculations, see the sidebar for a survey example.
EXAMPLE SURVEY CALCULATIONS
Acres surveyed: 200
Camera sites: 2 (1 per 100 acres)
Number of consecutive survey days: 10
Total photos of deer: 500
Buck photos: 125
Individual bucks identified: 25
Doe photos: 250
Fawn photos: 140
Population factor:
25 unique bucks ÷ 125 total buck photos= 0.2
Extrapolation factor: 1.11
(90% of deer seen by 10 days so 1 ÷ 0.9 = 1.11)
Note–This number is derived from a graph.
Population estimates:
Bucks: = 25 x 1.11= 28
Does: 250 x 0.2 = 50 x 1.11= 56
Fawns: 130 x 0.2 = 26 x 1.11= 29
TOTAL population: 113
Acres per deer: 200 ÷ 113 = 1.8
Buck to doe ratio: 25:50
Fawn to doe ratio: 26:50
(Fawn crop is therefore 26 ÷ 50= 0.52 or 52%)
Based on Demarais, et al. 2000
Some landowners may then use the photos to determine the population’s age structure. This involves knowing how to age deer in the field, a subject for another article. The Quality Deer Management Association has quite a lot of information on the subject. However, armed with the basic knowledge of the buck to doe ratio and total deer population in the area, land managers can begin to make better decisions on what deer to harvest during a season in order to keep the buck to doe ratio fairly equal. As for fawn recruitment, a good number is 1.5 per doe. Learning how to conduct a deer camera survey and interpret the results is the first step in properly managing your property for deer.
Resources:
Basinger, R. 2008. Westervelt Wildlife Services. Personal communication via email.
Demarais, S., W. McKinley, H. Jacobson. 2000. Using infrared-triggered cameras to survey white-tailed deer in Mississippi. FWRC Research Advances—Forest and Wildlife Research Center, Mississippi State University. Research Advances 5(3), FWRC-WF-160.
Henke, S. E. 1997. Do white-tailed deer react to the dinner bell? An experiment in classical conditioning. Wildlife Society Bulletin 25(2): 291-295.
Jacobson, H. 2001. How to conduct a deer census on your property: Part 1. Wildlife Trends, December 2001 issue.
Jacobson, H. and J. Kroll. Infrared camera census of white-tailed deer. Quality Whitetails 6(2): 7-11.
Koerth, B. H. and J. C. Kroll. 2000. Bait type and timing for deer counts using cameras triggered by infrared monitors. Wildlife Society Bulletin 28(3): 630-635.
Phillips, J. E. 2007. Trail Cameras—The long arm of the law. Hunt Club Digest. Winter 2007 issue.
Ruth, C. 2008. Deer Biologist with South Carolina Department of Natural Resources. Personal communication via email.
Samuel, D. 2008. Just Say “Cheese!” Whitetail Journal. April 2008 issue.
Snavely, J. 2004. Camera surveys 101. QDMA online article http://www.qdma.com/articles/details.asp?id=89.