
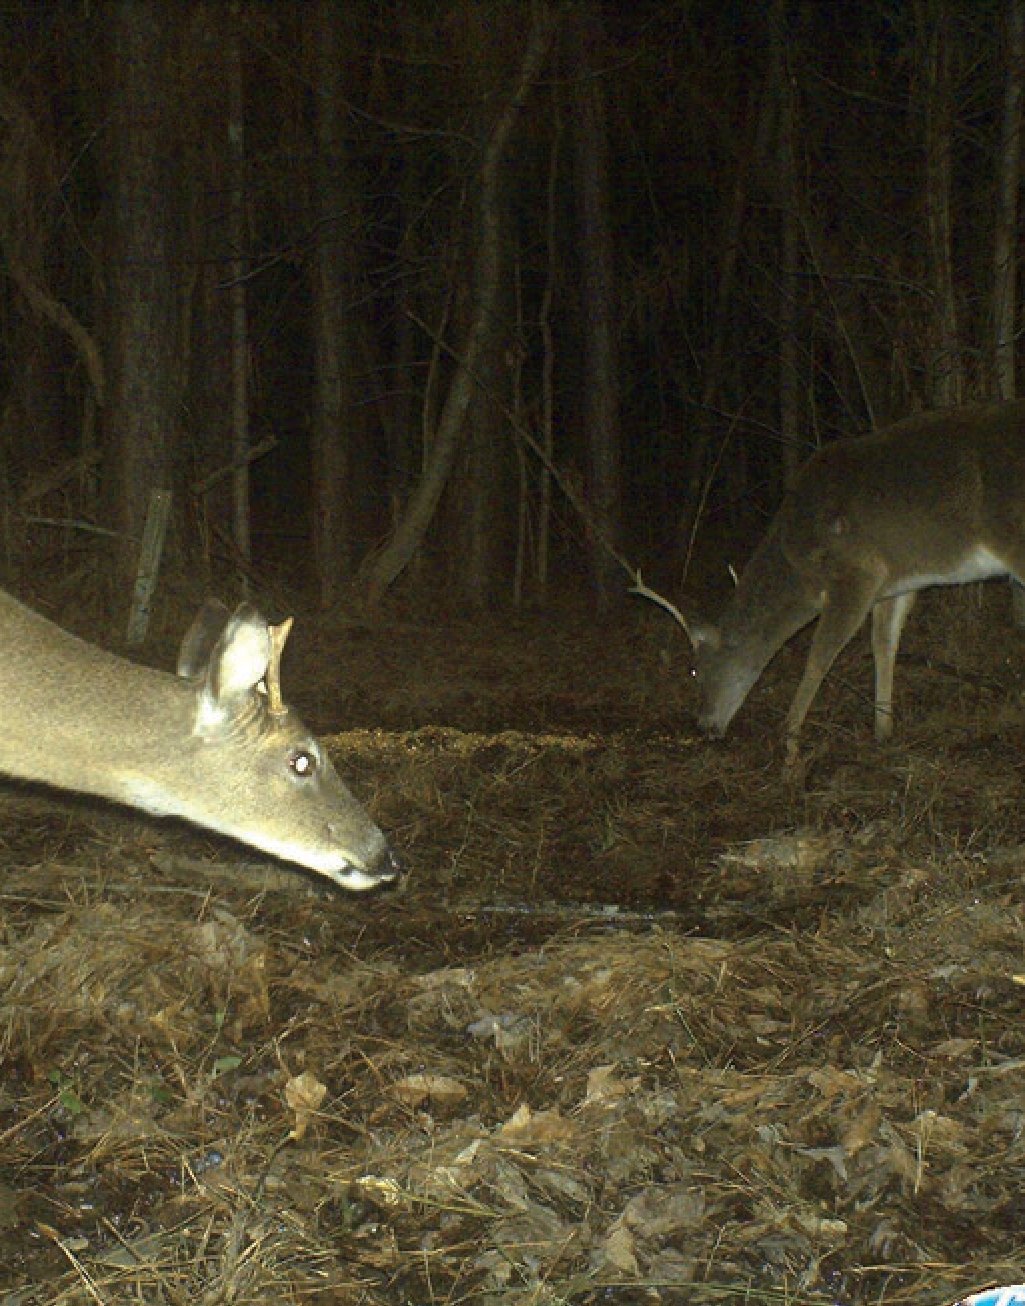
Making sound management decisions for your white-tailed deer population requires high quality data about that population, and trail cameras are the best way in the Southeast to collect those data. Population characteristics of most importance that can be estimated from a properly conducted camera survey include age structure, adult sex ratio, fawn recruitment (often called fawn crop), and population density.
Trail camera technology has advanced a lot since they were first used by MSU Deer Lab research professor Harry Jacobson and others to estimate deer population size. Building on this information, Steve Demarais and others at the Deer Lab verified the effectiveness of camera surveys at determining adult sex ratio, fawn crop, and density on other deer populations. We proved that a camera operating every 100 or 200 acres can estimate adult sex ratio and fawn crop within 3 days and deer density within 7 – 10 consecutive days. Having pictures of most of the bucks on a property is of great interest to hunters, and provides the basis for density estimates.
Efficiency of these early deer surveys was limited by the use of photographic film, because each camera could take no more than 36 photos without changing the film cartridge. Such limitations required daily camera checks to replace film when deer were abundant. The added delay and cost of film development are not missed by any of the older practitioners of deer surveys.
Important Deer Population Characteristics
Sex ratio, fawn crop, and age structure provide insight into the demographics and productivity of the population. A sex ratio that is skewed toward females, with 3-4 females for every buck indicates that the buck harvest has been too heavy and doe harvest has been too light. In most areas, a female-skewed sex ratio also indicates the population may have too many deer and individual deer quality may be compromised by lack of food resources. Most hunters now appreciate the need for adequate doe harvest to balance population numbers with the habitat’s forage supplies. A properly conducted camera survey allows a biologist to accurately estimate the total number of does needing removal so that sex ratio and density are optimized relative to the landowner’s goals.

The doe harvest depends primarily on fawn recruitment, or the addition of young animals into the population. The number of fawns produced each year (i.e., fawn crop) forms the basis of harvest recommendations. For example, if you want a population to remain stable you would only harvest the number of deer that approximately matches the fawn crop estimate after adjustment for natural mortality. So, if the fawn crop is determined to be 100, then a harvest of about 90 adults would keep the population stable (biologists typically assume about 10% may either die of natural causes or are otherwise lost from the population). However, to calculate the absolute number of fawns that are produced requires calculation of population density and the average number of fawns per doe. If you don’t have enough cameras to conduct a survey then only fawns per doe can be estimated.
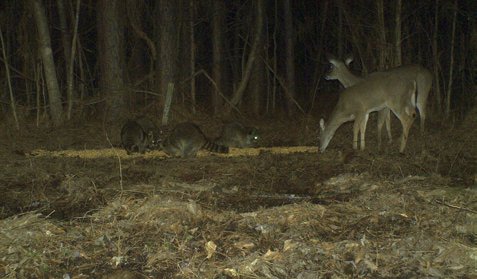
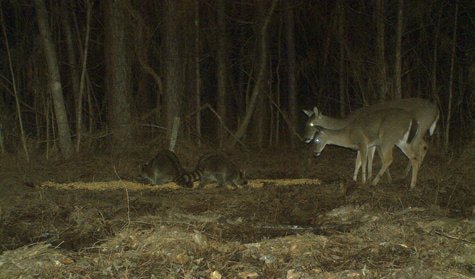
Another informative population characteristic that can be estimated from camera surveys is buck age structure. Buck age structure is simply the proportion of bucks in each age class. For example, if most of the bucks photographed were determined to be 1.5-years-old or 2.5-years-old and very few bucks were classified as 3.5-years-old or greater we would infer this population had a young buck age structure, which would indicate that most bucks are being harvested when they are relatively young. What most deer biologists would like to see is called an “even” buck age structure, which is a buck population with relatively equal numbers of young and older bucks. An even buck age structure tells the biologist that young bucks are being produced (i.e., deer herd is productive) and many of them are surviving until they are 3.5-years-old or greater, which is important if you are managing a deer herd to increase antler size.
One of the most exciting uses of a camera survey is seeing what bucks are available for harvest. Many people want to know if that buck that got away last year is around this year—and is he bigger? Biologists use these pictures to help hunters target certain bucks for harvest, and certain bucks for protection. Biologists point out to hunters which bucks have good antler characteristics, but are young and should be protected for a year or two. Harvesting only older bucks is the best formula for harvesting bigger bucks!
Tips on conducting a camera survey
Commercially available infrared-triggered camera units are readily available from many sources at reasonable costs. Depending on features and quality, retail prices can range from less than $100 to as much as $600. The adage of “you get what you pay for” is very applicable here. Our recommendation is to spend according to the importance of the information you are collecting and the time you are investing. Manufacturers specializing in trail cameras with good track records and internet reviews are the best bet for satisfaction.
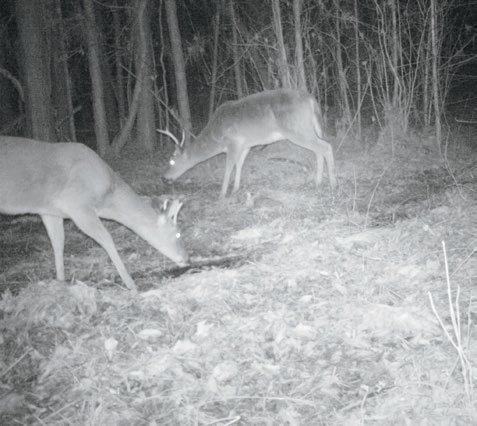
Now we’re going to review some general guidelines for conducting a camera survey. Please download MSU Extension publication 2788, Conducting Camera Surveys to Estimate Population Characteristics of White-tailed Deer, from MSUDeerLab.com for additional information. Obviously, the opportunity to photograph more deer increases each additional day the cameras are operating. In the research population, about 90% of deer were eventually photographed; unfortunately, it required 14 consecutive days of survey and a camera per 100 acres to obtain this level of accuracy. Using a camera per 200 acres for 14 days will decrease the level of accuracy down to about 68% during winter and 55% during fall (see Figure 1). Time of year the survey is conducted is important and will affect the percentage of the deer population eventually photographed. With a camera per 100 acres, the number of consecutive days required for a stable estimate of the buck population in the fall was about 11 days, but during winter the estimate stabilized after only 6-8 days. Another significant finding from the research deer population was that only 3-4 days are required for the sex ratio estimate to stabilize at the 100- or 200-acre camera density during fall and winter. In other words, if the objective of the survey were primarily to estimate the sex ratio of a population, that could be accomplished in as little as 3 survey days in fall or winter.
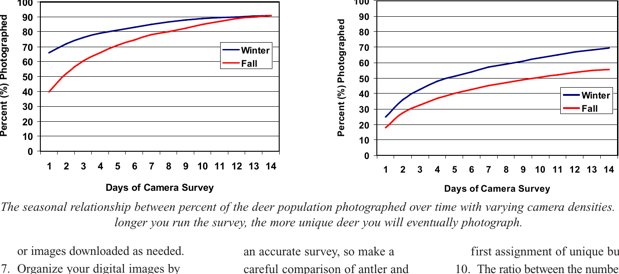
There is a big difference in the fawn crop estimates between fall and winter surveys. Camera surveys provided much higher estimates of fawn crop during winter. During September and October many fawns may not accompany the does to bait sites, because peak fawning occurs in July and August in Mississippi. Therefore, if an estimate of fawn crop is required, the survey is best conducted in winter.
One of the most important considerations in conducting a camera survey is the understanding that the probability of photographically capturing deer is a function of the ability to attract animals to the camera site. MSU Deer Lab researchers have shown the importance of bait attractiveness; survey accuracy varied from 92% on two study areas in Mississippi dominated by pines to 22% on a study area in Oklahoma where an abundant acorn crop competed with the bait for the deer’s attention. Camera surveys should be timed to avoid periods with highly attractive native foods like acorns. If the animals cannot be successfully attracted to bait, then the camera survey method has significant limitations. Therefore, it is important to schedule camera monitoring prior to or after acorn or crop availability. Obviously, locations where deer are accustomed to feeding make ideal camera survey sites; but feeders should be shut down during the survey and bait placed nearby. If deer are not using pre-baited camera sites, then sites should be relocated.
Please note that in some states it is illegal to hunt wild animals with the aid of bait, and improper use of baits could present health risks to deer and other wildlife. You should consult with your state wildlife agency biologist or conservation officer for more information prior to using corn or any other bait during a camera survey.
How best to implement a camera survey depends on your information needs (See Table 1 for a summary). If pre-season photographs of bucks potentially available for harvest is a primary objective of the survey, then fall would obviously be the appropriate time for the survey. Accurate estimates of deer density and sex ratio can be obtained in either pre- or post-season. However, for the very best estimates of population characteristics that include fawn recruitment, camera surveys should be conducted in winter at a camera density of 1 camera per 100 acres. Fawn crop is greatly under-estimated during pre-season surveys in areas with late breeding seasons, such as in much of the Lower Coastal Plain of the Southeast (for example, the southern third of Mississippi and Alabama).
Camera stations should be selected carefully and pre-baited for 4-6 days. Cameras should be set on a 5- to 10-minute delay and run for no less than 5 consecutive days. Running cameras for up to 10 days can significantly improve results, especially if individual buck photographs are an important objective. If camera numbers are limited, each camera may be rotated to a new station after each census period for up to 4 stations per camera. However, it is best to disperse cameras over the entire area for each survey period.

If obtaining individual buck photos is your only objective, an effective method is to place cameras at scrapes. Most bucks, along with many does and even fawns, will visit scrapes within their home range. It is common to photograph as many as 3 or 4 bucks in one night and as many as 10 or more during a two-week period at a single scrape. Depending on location and other factors, scrape activity will usually start by early November and continue through most of the deer season.
The infrared camera survey method offers an exciting and practical option for deer managers and hunters. It may not provide all the answers needed, but it is an effective tool that can be used in conjunction with other deer data collection techniques. It is guaranteed to add a new level of knowledge and element of excitement in the experiences associated with deer management and hunting.
How to conduct a camera survey of white-tailed deer:
- Depending on desired accuracy, grid the property into 100- or 200-acre compartments. Locate a bait site with high deer use near the center of each compartment and clear any vegetation at the bait site or between the camera and the bait site. Vegetation, including grass and small branches, can interfere with the camera view and flash effectiveness.
- Select a tree or install a post 15-20′ (varies depending on individual camera focal length) from the center of the bait site and set the camera facing either North or South to avoid sun glare. Pay special attention to the view of the camera, including clutter or obstructions that could interfere with photo-capture of deer. A solid background of vegetation 40-50 feet away from the camera limits wasted photos of deer too far away for adequate identification. A reference point or numbered sign in the view can serve to identify the site. Most cameras utilize a “test mode” to evaluate proper placement.
- Pre-bait each site for 5 days by placing 30-40 pounds of corn in the center of the circle and check bait sites at least every other day.
- Set the camera to record date and time with 5-minute delay between photographs. If your camera allows a 2-3 photo burst, this is a good option that will improve the chance of getting just the right view. However, only include the best photo in the survey tally.
- Operate cameras 5-14 days depending on your budget for bait and the desired accuracy of estimation and check often enough to insure bait remains available. Make sure the camera is taking quality photos the very first time you check it, to avoid wasting time and resources. Depending on system used, storage cards can be replaced or images downloaded as needed.
- Organize your digital images by station number. All images must be kept separated by site to properly evaluate a survey.
- Analyze the photos to determine total number of photos of each bucks, does, and fawns attending each station. If you cannot identify sex and age with confidence, then don’t use that photo for data collection. As you find antlered bucks, place a copy of those photos into separate folders organized by number of antler points.
- After you’ve tallied all bucks, does and fawns, enter your antler-point folders. Correctly identifying individual bucks is the key to an accurate survey, so make a careful comparison of antler and body characteristics, paying attention to subtle differences in angle of the deer when the photo was taken. Small variations in perspective can alter visibility of points and bumps that may be key identifying characteristics. Create a new folder for each unique buck with a name indicative of some feature of the buck’s antlers (for example – “9 Point hooked right brow”). After you complete this process, go back and review all photos within each of the unique buck folders and look for errors. Assume you made errors, because almost everyone does during their first assignment of unique bucks.
- The ratio between the number of unique, individual bucks photographed and the total number of buck photographs is used to calculate a population factor. This factor is applied to the total doe and fawn photographs to estimate their numbers. These calculations can then be used to provide estimates of the population characteristics.
For further information:
Conducting Camera Surveys to Estimate Population Characteristics of White-tailed Deer
http://www.msudeerlab.com/publications.asp
Managing White-tailed Deer: Camera Surveys http://www.aces.edu/pubs/docs/A/ANR-1395/ANR-1395.pdf
Continuum of camera survey intensity table:
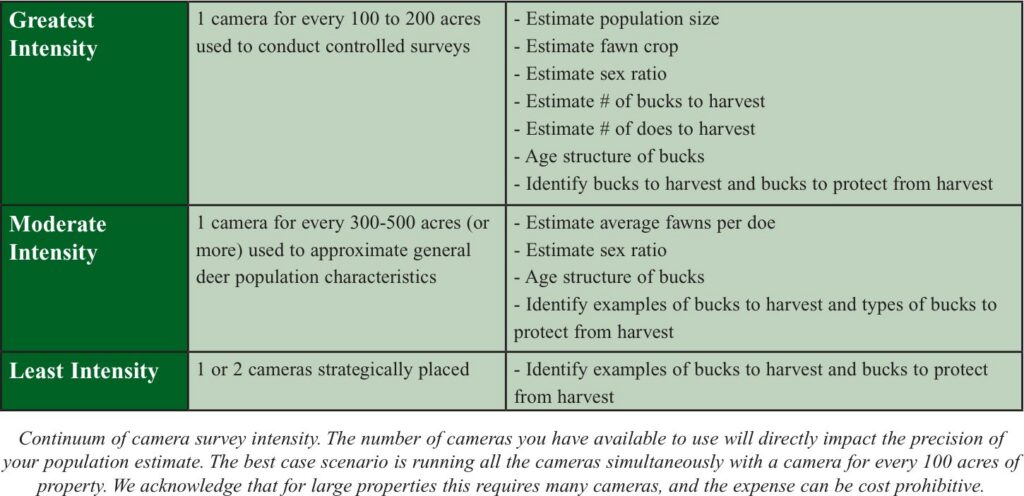
Continuum of camera survey intensity. The number of cameras you have available to use will directly impact the precision of your population estimate. The best case scenario is running all the cameras simultaneously with a camera for every 100 acres of property. We acknowledge that for large properties this requires many cameras, and the expense can be cost prohibitive.