
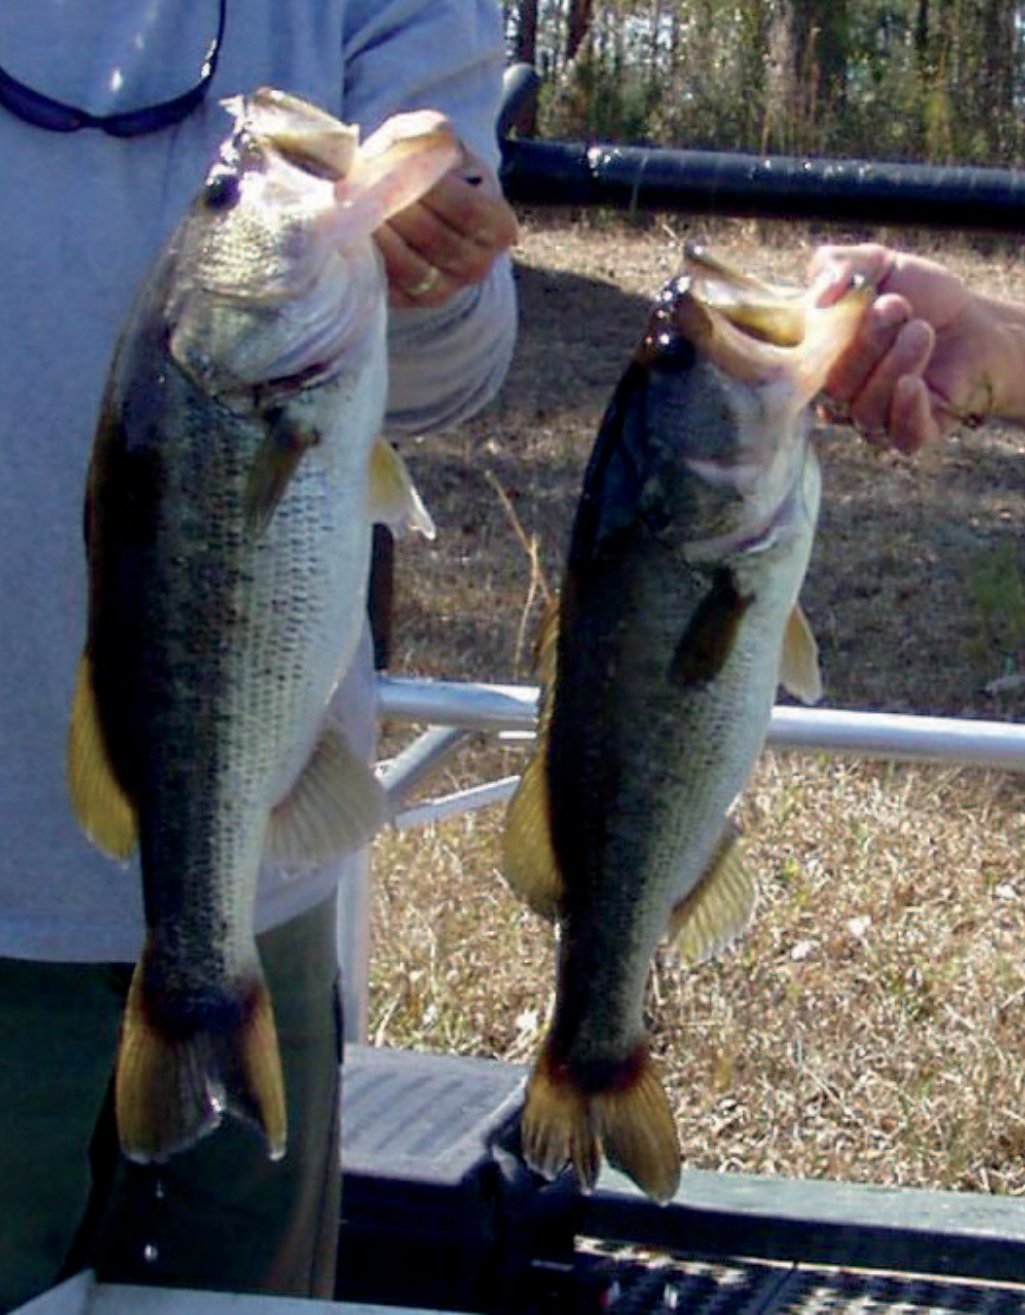
Electrofishing is an important part of evaluating a fish population. Paired with angling success, a biologist can get an idea of what fish are present, in what numbers, and make sound decisions for creating a management strategy to improve a fishery and achieve the landowner’s objectives.
Folks constantly ask us about the electrofishing boat and how it actually works without shocking us. Our pond boat is a 16 ft. X 48 inch flat bottom Jon boat with a 40 hp motor. On our rig the boat itself is the ground and the booms sticking out the front with the stainless steel droppers are the positive. Some rigs use separate cables over the sides for the ground, but by using the boat, you produce a better electrical field. The padded railing around the front deck is placed in a manner that people can lean out and dip fish without falling in. Although safety is a priority when shocking, I have seen this happen a couple times in my 25 year career. No one has ever been killed as far as I know from electrofishing, but if you touch the water and the boat simultaneously with the peddle down, you will feel it. If the water is highly conductive, the shock is mild, but if the water is soft and has very low conductivity the volts we are using are very high, even though the amps produced are low, and you will really feel it. We always wear rubber soled shoes, and the deck and in front of the driver’s seat has a rubber mat for additional insulation. Sometimes we use one dipper and other times two, depending on the sample objective and numbers of fish expected. The driver always wears ear protection and sometimes the dippers do also. Most use 6-8 ft long, plastic or fiberglass handled dip nets. If we are targeting catfish, the net webbing may be rubber to eliminate their spines getting tangled in the traditional green nylon nets. Some shocker boats have lights on them for sampling at night. Depending on the habitat type and waterbody, night sampling reveals more fish and a wider assemblage of species present versus a daytime sample where some species may not be in a water depth suitable for shocking due to lack of cover until after dark. Our generator puts out up to 7,500 watts and up to 1,000 volts. The “Shocker Box” controls everything including various pulses ranging from 7.5-120 per second and amperage from 1 – 62. The settings we use depend on the objectives for sampling, the water’s conductivity and species of fish being targeted. There is a peddle in front (some boats have one in front and back) that when pushed, puts electricity into the water while a timer keeps track of the seconds sampled, which we convert into a fish per minute or hour index that gives us the CPUE (catch-per-unit-effort).

Electrofishing is usually performed in the littoral zone (shallow areas along the shore and islands), along or above structure and along shallow to deep transition areas. For deep water shocking the dropper cables, both positive and negative, are rubber coated, allowing the electric current to travel through the water column and create the electrical field only at the exposed end of the dropper at the desired depth to shock. The size of the electrical field and its effects depends on the fish species, size and water conductivity. In some waterbodies fish need to be within four feet of the booms and less than four feet deep. Other times fish are stunned as far away as 15 feet outside the booms, and greater than 10 feet below the surface. Some fish are completely stunned and easy to dip, while others fight the electricity and can be very difficult and sometimes almost impossible to dip. Research has shown that less than 1 % of the fish shocked perish, and generally those are fingerlings and/or fry, which is why sometimes we let off the peddle if we notice a ball of fry getting close to the booms. All remaining fish wake up and swim away unharmed. When the “Shocker Box” is adjusted to target catfish only, they come to the surface as far away as 100 yards. It does not stun them, just makes them come to the surface and swim erratically, sometimes long enough to be dipped, and sometimes getting away at the last minute.
After fish are dipped, they are placed into an aerated tank with salt to reduce stress and skin/scale damage until measured, weighed and then released. After each sample the tank water is pumped out and refilled. The water temperature can rise in the tank when crowded with fish from the sun, fish depositing waste, regurgitating their last meal, and putting out carbon dioxide in the tank which is why it is changed so frequently. Generally larger fish get hit (shocked) harder than smaller ones as they have more surface area to transmit electricity and occasionally take longer to wake up. Most fish by the time we measure and weigh everything eagerly swim away. Once in a while a big fish will float or lie nearby and eventually wake up, or it is helped upright until it swims away.
The shocker can affect turtles, snakes, alligators, birds and even manatees. If we encounter a non fish animal, we simply release the peddle and allow it to move away and we resume. The larger the gator, the more thrashing they do. I have seen them up to about 12 feet get shocked and those are dangerous that close, especially to the driver. Gators have a tendency to try and climb into the back of the boat by the driver. That makes it interesting during night sampling. The guys in the front think its funny, but when you see teeth and a webbed, clawed foot coming at you out of the dim light, it scares you know matter how used to it you are! Manatees also cause a threat as they can literally flip the boat if they are in shallow water. My first month out of college I was on the job electrofishing in the St Johns River in Central Florida and in front of the boat a huge swirl with the water dropping about a foot occurred just inches in front of the boat and next was this 11-12 foot alligator throwing his head between the railing and onto the boat deck. Being from Missouri, that was really scary at first, then I realized it was pretty cool!
The term Monkey Rig is frequently used when describing illegal electrofishing. Those were, and are still today, designed specifically to be used for catfish and most are built from old crank telephone generators. The reason this device works so well on catfish is because it produces low amperage, medium volts, with low pulses per second, which catfish are very susceptible. When I did my catfish research in the late 80’s and early 90’s we actually abandoned the modern day shocker and used an old telephone rig we built ourselves in some areas of the study, and it was amazing how many catfish were in certain stretches of the river. In some areas the water literally turned white with bellies up. We can now use the modern ‘Shocker Box’ to simulate this and we have seen catfish surfacing far away and jumping like a tarpon to escape.

Electrofishing data is a snap-shot of the fish population at the time it is performed and helps biologist/managers to develop management prescriptions for landowners to achieve their lake goals. Electrofishing is best for a lake evaluation when done in the spring or fall, and in my opinion best in spring. Water temperatures are more conducive for fish to be near shore and largemouth bass closer in preparing to spawn. It allows managers to create a starting point, and then provides important information on progress once a management strategy is implemented. It samples all types of habitat, from shallow water to fairly deep. Electrofishing can be used as a lone sampling method or as a part of a suite of sampling tools by adding seine, hoop nets, gill nets, minnow traps, trawls, Rotenone (fish toxicant) and angling. In most private lake situations, electrofishing, combined with angling results, are the best fish population evaluating techniques; however, in larger waterbodies more sampling methods may be employed to get the best possible representation of the fish population present.
Data collected during sampling can be used to create a Species Present list, a Species Composition of what percentage (by number and/or weight) of each species is represented, Length Frequency within a species and Relative Weight Index (condition of fish) can be calculated. Other information that can be collected includes stomach samples, usually done by “tubing” on largemouth bass which does not require hurting the fish to identify food sources for various sized fish and drawing blood samples to document various genetic traits.
Some of these should be standard in any pond evaluation and some are very advanced and expensive to have done and only necessary in intense research and or environmental impact monitoring.
Two of the basic data analyses done for largemouth bass are Length Frequency and Relative Weight Index. We believe this is best achieved by combining electrofishing results with angling results. In some waterbodies, despite the best efforts, electrofishing does not do well documenting big fish. Angling during the spring, collecting lengths and weights and turning the data over to your pond manager can help make the picture more accurate and aid in the decision making process to implement the best management practices. Unfortunately some do not like to keep records of this valuable data, but some do provide comments like, “lots of big fish up to “X” pounds were caught this year” or “no fish above X pounds was caught this year” which also helps us understand what is going on under the water.

The Length Frequency tells the biologist/manager if all size groups are well represented in the population. Where there are gaps, it needs to be determined if overharvesting or lack of food suitable for fish below or in those gaps (which is usually too many fish just below the void) are the cause. In private lakes it is usually too many predators and not enough forage opposed to over harvest, which is more common on public waterbodies. With those results, harvest guidelines can be set and possibly a supplemental stocking of forage may also be implemented. Once a Length Frequency is established this can be re-created each time another electrofish sample is taken and compared to previous sample results to track improvements or shortfalls in the population structure as time goes on.

Largemouth Bass Length Frequency – Big Lake Spring 2007, 2009 & 2011
Total Length (Inches) | Spring 2007 | Spring 2009 | Spring 2011
1 | 0% | 0% | 0%
3 | 0% | 0% | 0%
5 | 0% | 0% | 5%
7 | 5% | 5% | 20%
9 | 20% | 10% | 10%
11 | 5% | 20% | 5%
13 | 5% | 15% | 10%
15 | 0% | 10% | 5%
17 | 0% | 5% | 0%
19 | 0% | 0% | 0%
21 | 0% | 0% | 0%
23 | 0% | 0% | 0%
The same can be done with relative Weight Index to monitor improvements or declines in various sized bass from previous results. Our “Standard” for relative weight comes from Anderson, R.O. and R.M. Neumann. 1996. Length, weight, and associated structural indices. pp. 447-482. In B.R. Murphy and D.W. Willis (eds.). Fisheries Techniques, American Fisheries Society. These results help us determine how many bass (actually pounds) per year should be removed from the population and in what size class. Generally the size bass needed to be removed is 12-15 inches (about one pound each), and is around 25 per acre depending on how productive your waterbody is. However, this varies in each lake and can change after each sample conducted depending on how well the harvest and or forage stocking recommendations were followed. We have seen lakes requiring 10-13 inch bass, 30-35 per acre needing removal and also 17-19 inch bass, 6-8 per acre needing removal. When dealing with fish removal, it is based on weight (called biomass), so when prescribing larger fish being removed, a lot fewer per acre is the target.

Largemouth Bass Relative Weight – Big Lake Spring 2007, 2009 & 2011
Total Length (Inches) | 2007 Sample Weights | 2009 Sample Weights | 2011 Sample Weights | Standard Weights
10 | ~0.30 | ~0.30 | ~0.30 | ~0.30
11 | ~0.40 | ~0.40 | ~0.40 | ~0.40
12 | ~0.50 | ~0.50 | ~0.50 | ~0.50
13 | ~0.65 | ~0.65 | ~0.65 | ~0.65
14 | ~0.85 | ~0.85 | ~0.85 | ~0.85
15 | ~1.00 | ~1.00 | ~1.10 | ~1.10
16 | ~1.30 | ~1.30 | ~1.40 | ~1.40
17 | ~1.60 | ~1.60 | ~1.70 | ~1.80
18 | ~1.90 | ~2.00 | ~2.10 | ~2.20
19 | ~2.30 | ~2.40 | ~2.60 | ~2.70
20 | ~2.80 | ~2.90 | ~3.10 | ~3.30
21 | ~3.30 | ~3.50 | ~3.80 | ~4.00
22 | ~4.00 | ~4.20 | ~4.60 | ~4.80
23 | ~4.70 | ~5.00 | ~5.50 | ~5.80
24 | ~5.60 | ~6.00 | ~6.60 | ~7.00
25 | ~6.50 | ~7.20 | ~7.90 | ~9.20
How often to electrofish is a widely varied topic between management companies. This service can be performed annually, but we feel every two years on an intensely managed waterbody is sufficient to document progress. Some implemented management techniques need more time than one year to show a detectable change in the population/data. This also reduces annual management costs, which allows for money to be saved or additional funding to be spent on direct management such as feeders/feed, fertilizer, stockings, habitat improvement, plant management, etc. Obviously on research projects electrofishing may be done annually, bi-annually or quarterly (during each season) to document changes depending on the research objectives.
Prices for electrofishing services vary depending on your location and how thorough the data analysis and management strategy are that you desire. When performed properly electrofishing is a valuable tool to evaluate a fish population and help make management decisions for your waterbody. Whether you prefer to just ride around and be given recommendations from the boat deck, want a one or two page summary or a thorough data summary with detailed management strategy easy to follow so you or your staff can perform some or all the recommendations yourself for your waterbody, know what the end product is for your dollar.